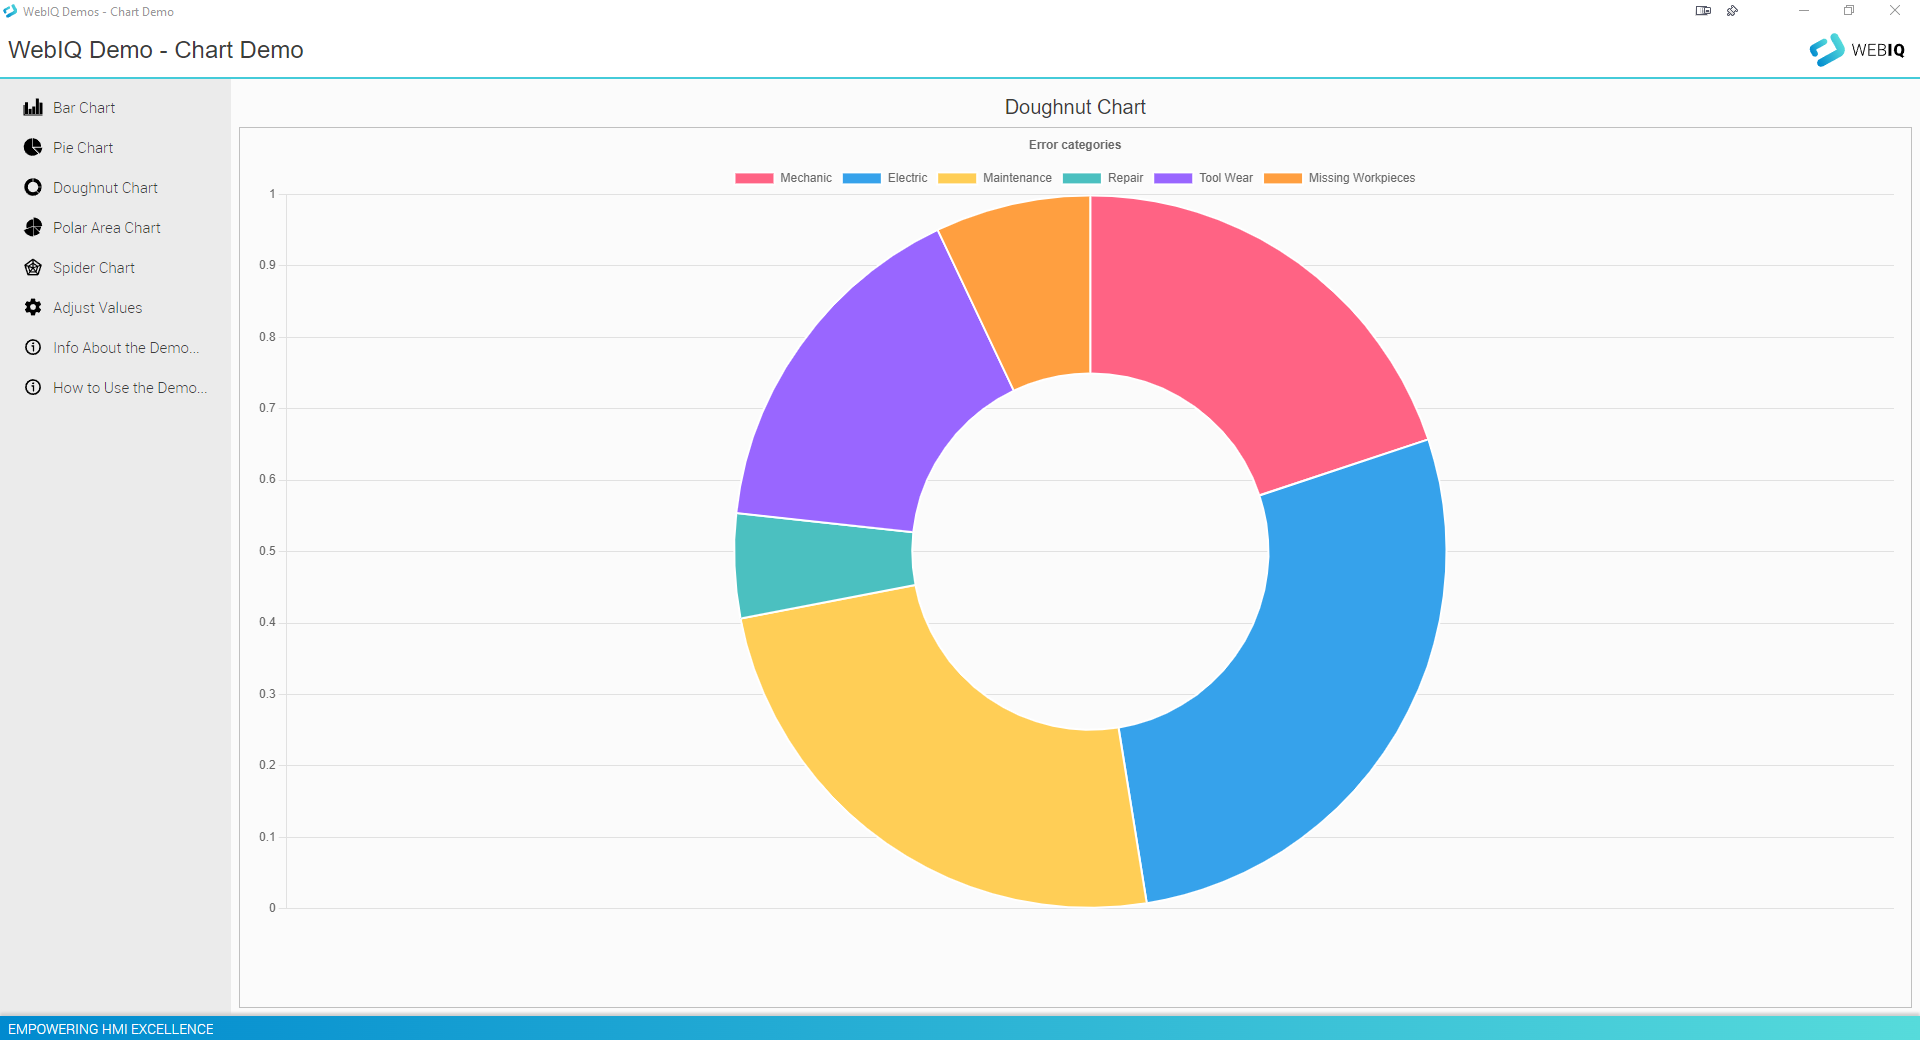
Want to display some cool charts for illustrating your current HMI process data? You want to save time and money by utilizing open-source technology instead of reinventing the wheel? Then you should have a look at this WEBIQ BEST PRACTISE DEMO: The Chart Demo shows you how to display values in a WebIQ Chart widget utilizing the open-source Chart.JS library that we have already prepared for you as a WebIQ package so you can just go ahead and import it into your own HMI and start using it immediately!
What Does The WebIQ Chart Demo Include?
The demo contains five different chart types utilizing Chart.JS: bar chart, pie chart, donut chart, polar area chart and spider chart which can all be modified on-the-fly using the integrated value adjustment. You can also try it online now!
Bar Chart
A bar chart makes it easy to compare certain values side by side. The values are represented as vertical bars.

Doughnut & Pie Chart
These charts types are probably most often used with this widget as they allow for easy comparison of certain values. The only difference between them is how the data is displayed in relation.


Polar Area Chart
This type of chart is similar to the pie and doughnut charts but in this case each segment has the same angle, but the radius of each segment differs depending on the value. This is most often used when in addition to compare similar values the scale of the values shall be shown for context.

Spider Chart
A spider chart (or radar chart) allows for showing variations of datapoints.

How Can I Change The Values?
When using this widget inside WebIQ Designer you can simply connect your desired items (process variables, tags) from your PLC to these charts. In this demo app we have also added an option to modify these values on-the-fly to simulate value changes for illustration purposes.
To change the values just click on “Adjust Values” in the navigation on the left to show sliders that allow you to change those values directly. You will see that sliding the handles will change the chart values immediately. Pretty cool, isn’t it?
How Did We Create This Chart Demo With WebIQ?
We simply downloaded the Chart.JS package than contains the Chart.JS library and the WebIQ Chart widget package that utilizes this library. Then we imported both packages into our HMI in WebIQ Designer and could then just drag & drop an instance of the Chart widget into our HMI in the Layout Manager.
Then we simply connected items to the widget and there we go! It’s that easy. Just note that when you download the demo you also have to download and install the WebIQ Chart widget package – otherwise you will not be able to configure the widget from inside WebIQ Designer.
Configuring The Widget
After installing the packages in your app or when opening the demo app and the widget package in WebIQ Designer you can now go ahead and change, delete or add new items to the widget and also switch the chart types easily. You’ll also notice the widget also features a line chart!

Now It’s Your Turn
Why not go ahead and download the demo HMI app right now, load it into WebIQ Designer and modify it to get to know our Chart widget hands-on?
And if you want to create your own custom widgets or want to integrate other open-source web libraries into your project you can find more information on that in our WebIQ Developer Manuals (Frontend). Just login or sign up below to gain access!
If you haven’t downloaded WebIQ yet just click below to signup and download the free trial version of WebIQ now!


